Execution Table
The Execution Table provides a paginated, filterable view of all test execution results stored in Elasticsearch.
Features
- Pagination — Navigate through results with configurable page size
- Sorting — Sort by timestamp, test name, hostname, exit code, or severity
- Advanced filtering — Filter by technique, hostname, threat actor, tags, error codes, and date range
Shared FilterBar
The Execution Table shares its filter bar with other Analytics dashboard tabs, providing a unified filtering experience.
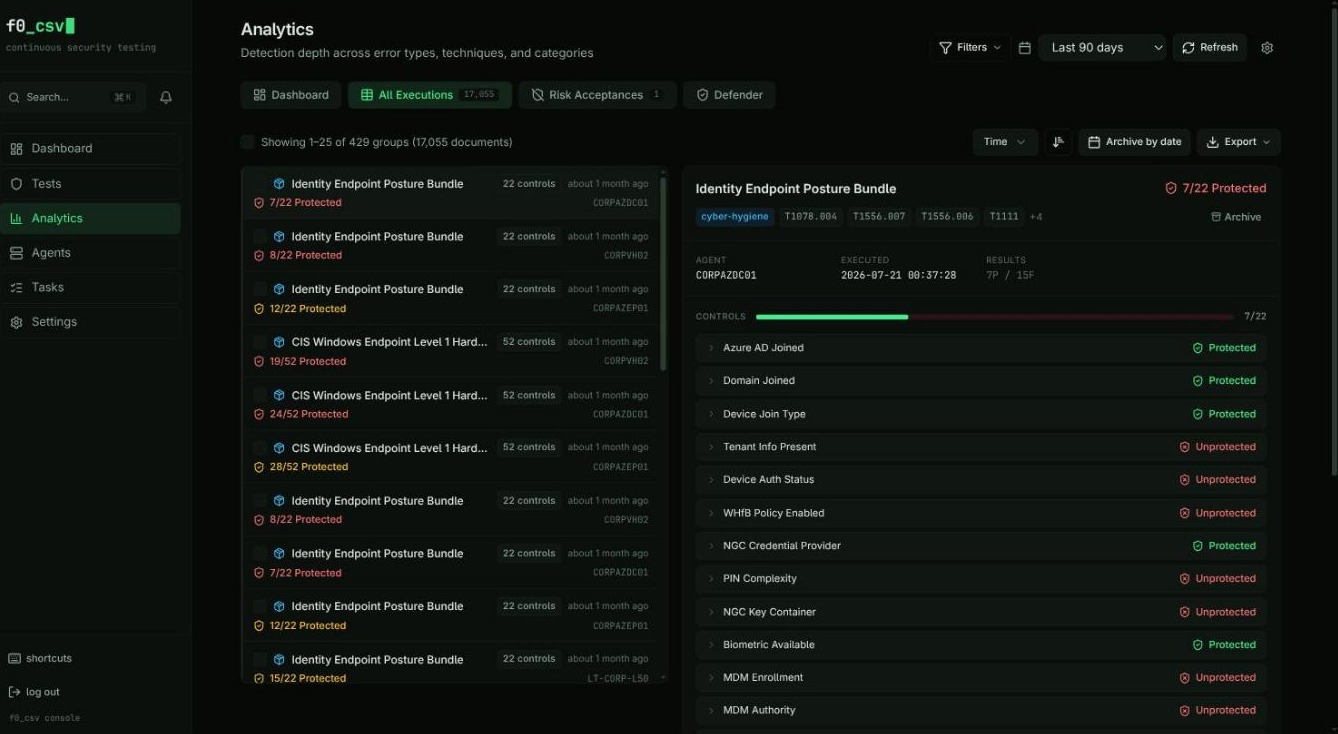
Bundle Results
Tests that produce per-control results (cyber-hygiene bundles, multi-stage tests) are grouped under collapsible parent rows:
- Parent row shows the bundle name, a "X/Y Protected" summary badge, and an item count badge
- Expanding reveals individual sub-rows with per-control results
- Skipped stages (non-cyber-hygiene with exit code 0) show a "Skipped" label
- Standalone tests render as flat rows
Archiving
Use the Archive button to move old execution results out of active views. Archived results are still queryable but hidden from the default view.