Defense Score & Trends
The Defense Score is the primary metric for measuring your security posture.
What Is the Defense Score?
The Defense Score is an aggregate percentage representing how many of your executed security tests were detected (or blocked) by your defenses. A score of 85% means 85% of test executions resulted in a "Protected" outcome.
Score Calculation
Defense Score = (Protected Executions / Total Executions) × 100
Each test execution is classified by its exit code:
- Exit code 1 → "Protected" (defense detected/blocked the test)
- Exit code 0 → "Unprotected" (test completed without detection)
- Other exit codes → "Error" (test failed to execute properly)
Breakdowns
The Defense Score can be broken down by:
- Test — Score per individual test
- Technique — Score per MITRE ATT&CK technique
- Category — Score per test category
- Hostname — Score per endpoint
- Severity — Score per severity level
Trend Analysis
The trend chart shows the Defense Score over time with a configurable rolling window:
- 7 days — Short-term operational view
- 30 days — Monthly trend
- 90 days — Quarterly trend
A downward trend indicates deteriorating security posture and may trigger threshold alerts.
Dual Defense Score
The dashboard overlays the real-time score with a trend line, making it easy to see both the current state and the trajectory.
Dashboard Layout
The Analytics Dashboard uses a multi-tab interface with four main areas:
Dashboard Tab
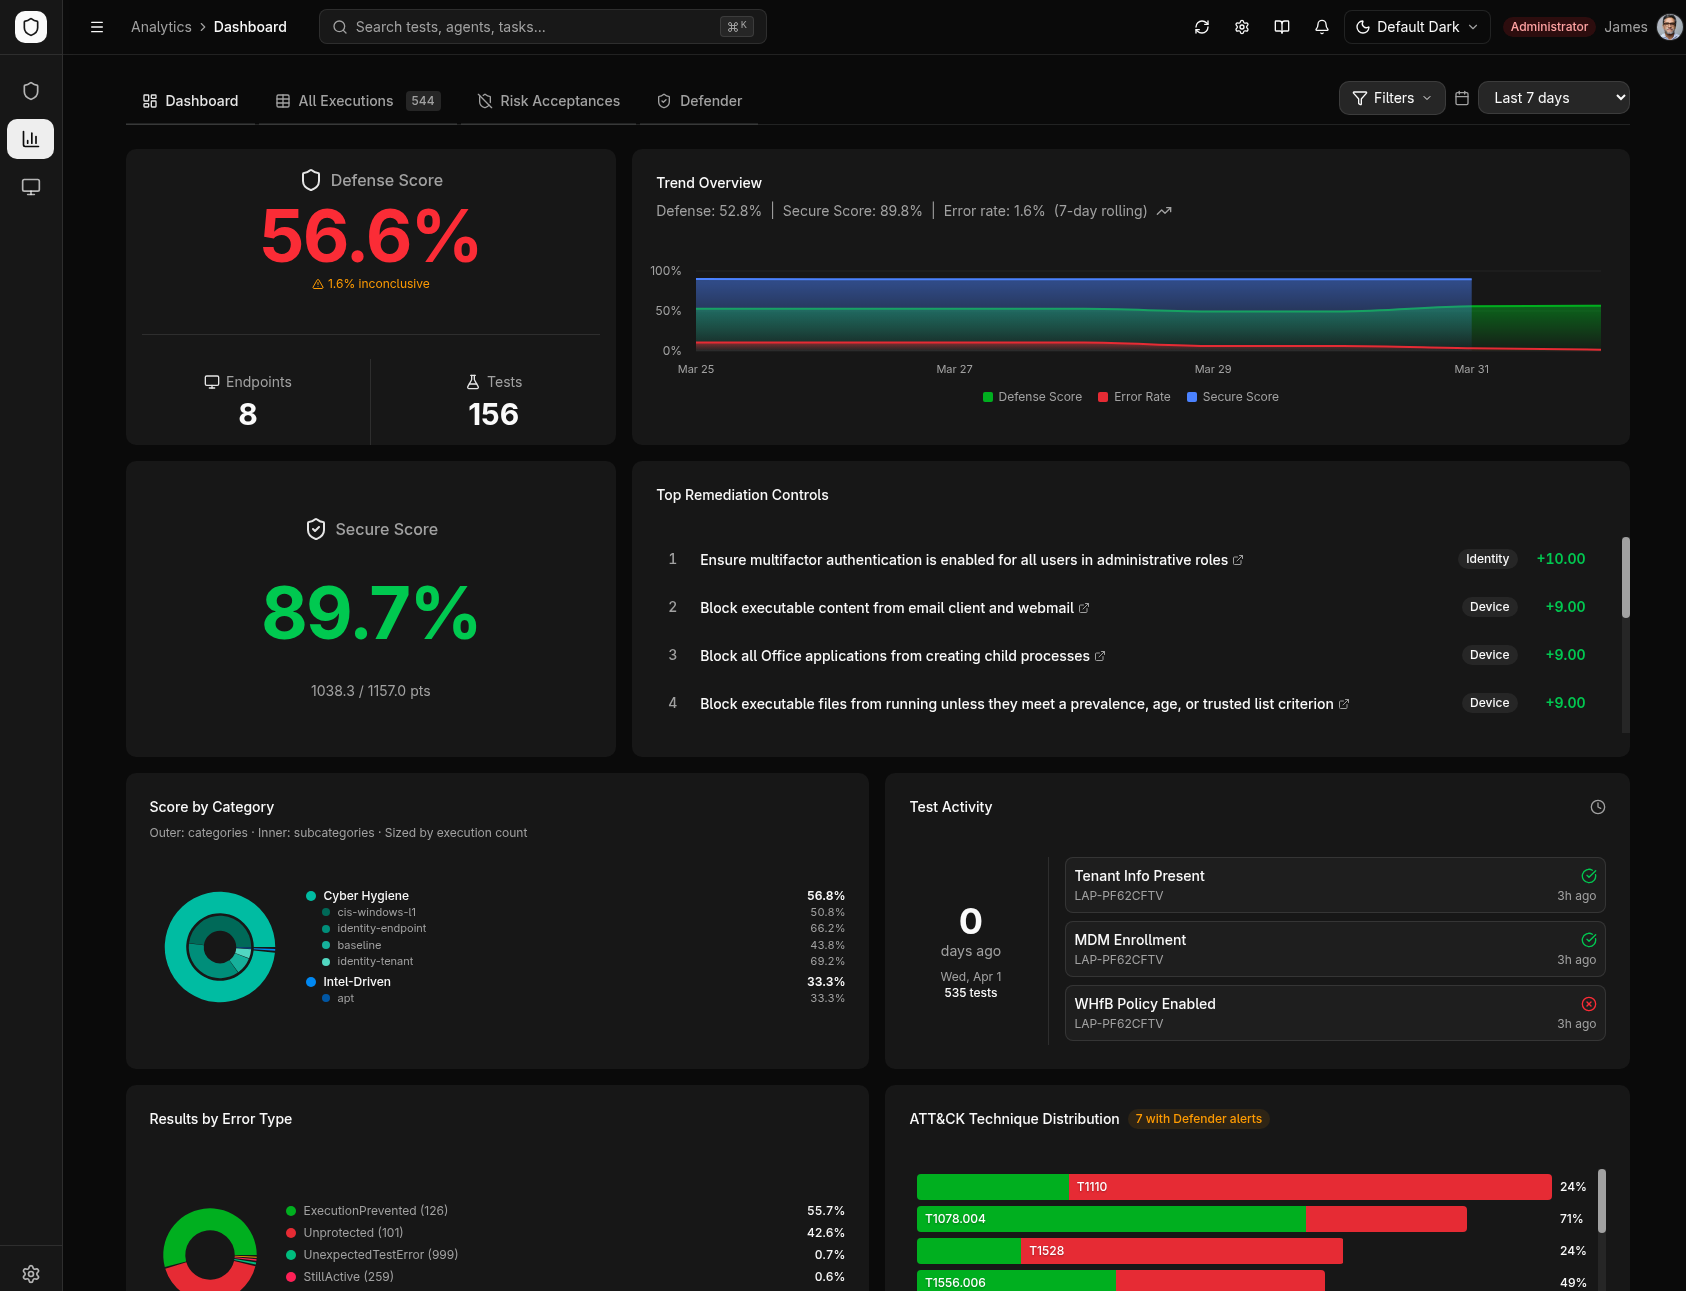
The Dashboard tab is the primary visualization hub. It contains the following components:
- Hero Metrics Card -- Displays the Defense Score with a trend indicator (up/down arrow), total unique endpoints, executed test count, error rate percentage, and risk-accepted count.
- Trend Chart -- Multi-series time chart plotting Defense Score and error rate over time. When Microsoft Defender is configured, the Secure Score trend is overlaid for cross-platform comparison.
- Error Type Breakdown -- Pie chart showing the distribution of error types across executions.
- Coverage Treemap -- Interactive hierarchical visualization of per-host test coverage (see below).
- Category Breakdown -- Nested donut chart with an outer ring for test categories and an inner ring for subcategories, sized by execution count.
Executions Tab
The Executions tab provides a full data table of individual test executions. Features include:
- Configurable column visibility and sortable columns
- Multi-select with bulk operations (archive, accept risk)
- Bundle grouping -- related bundle controls are grouped under collapsible parent rows showing a "X/Y Protected" summary badge
- CSV and JSON export with consistent timestamp formatting
- Expandable detail panels for each execution
Risk Acceptances Tab
The Risk Acceptances tab tracks security exceptions:
- Select failed executions from the Executions table
- Provide a justification (minimum 10 characters)
- Choose scope: test-specific, host-specific, or global
- Active acceptances appear with badges throughout the dashboard and are factored into the Defense Score
Risk acceptances can be revoked with a single click, which re-includes those results in score calculations.
Defender Tab
When Microsoft Defender is configured, a dedicated Defender tab appears with a per-execution detection rate, Secure Score, alert correlation, MITRE technique overlap, and an alert drill-down drawer. See Microsoft Defender for the full tab walkthrough.
These are distinct metrics. The Defense Score measures whether a test's exit code reported it as protected; the Defender tab's Detection Rate measures whether Microsoft Defender raised a correlated alert. The Defense Score counts cyber-hygiene controls; the Detection Rate excludes them. Auto- resolve never affects either score.
Coverage Treemap
The Coverage Treemap provides a drill-down view of test coverage per endpoint:
- Each cell represents a host, sized by the number of tests executed
- Cells are color-coded by coverage percentage:
- Green (80%+) -- Strong coverage
- Amber (50--79%) -- Partial coverage
- Red (below 50%) -- Low coverage
- Click a host cell to drill down to individual test results on that endpoint
- Three baseline comparison modes control how "100% coverage" is defined:
- 90-day baseline -- Uses the total distinct tests seen in the last 90 days
- 30-day baseline -- Uses the total distinct tests seen in the last 30 days
- Current window -- Uses only tests within the currently selected date range
Filtering
The filter bar runs across the top of every tab and supports multiple simultaneous dimensions:
| Filter | Description |
|---|---|
| Date Range | Preset ranges (24h, 7d, 30d, 90d, all time) or a custom start/end date |
| Hosts | Multi-select dropdown of endpoint hostnames |
| Tests | Multi-select dropdown of test names |
| Techniques | Multi-select dropdown of MITRE ATT&CK technique IDs |
| Categories | Multi-select dropdown of test categories |
Filters are additive -- selecting multiple values in the same dropdown narrows results. Each dropdown shows a count badge when filters are active. The filter bar is collapsible to save screen space.
Use the preset date range buttons (24h, 7d, 30d, 90d) for quick time-window changes. The trend chart automatically adjusts its time axis granularity to match the selected range.
Data Export
From the Executions tab, you can export data in two formats:
- CSV -- Spreadsheet-compatible format with consistent timestamp formatting
- JSON -- Machine-readable format suitable for integration with other tools
The export respects all currently applied filters, so you can narrow the dataset before exporting.
Real-Time Updates
The dashboard automatically reloads data when you:
- Change any filter or date range
- Switch tabs
- Modify Elasticsearch settings (index pattern changes)
- Toggle Defender integration on or off
Only the active tab's data is fetched, so switching tabs triggers a fresh load for that tab while keeping others cached.