Security Dashboard
/dashboard is the console's landing page and the single place posture is
summarised across all three data sources — the test library, the endpoint
fleet, and Elasticsearch analytics. It replaced the three separate module
dashboards in 2.1.
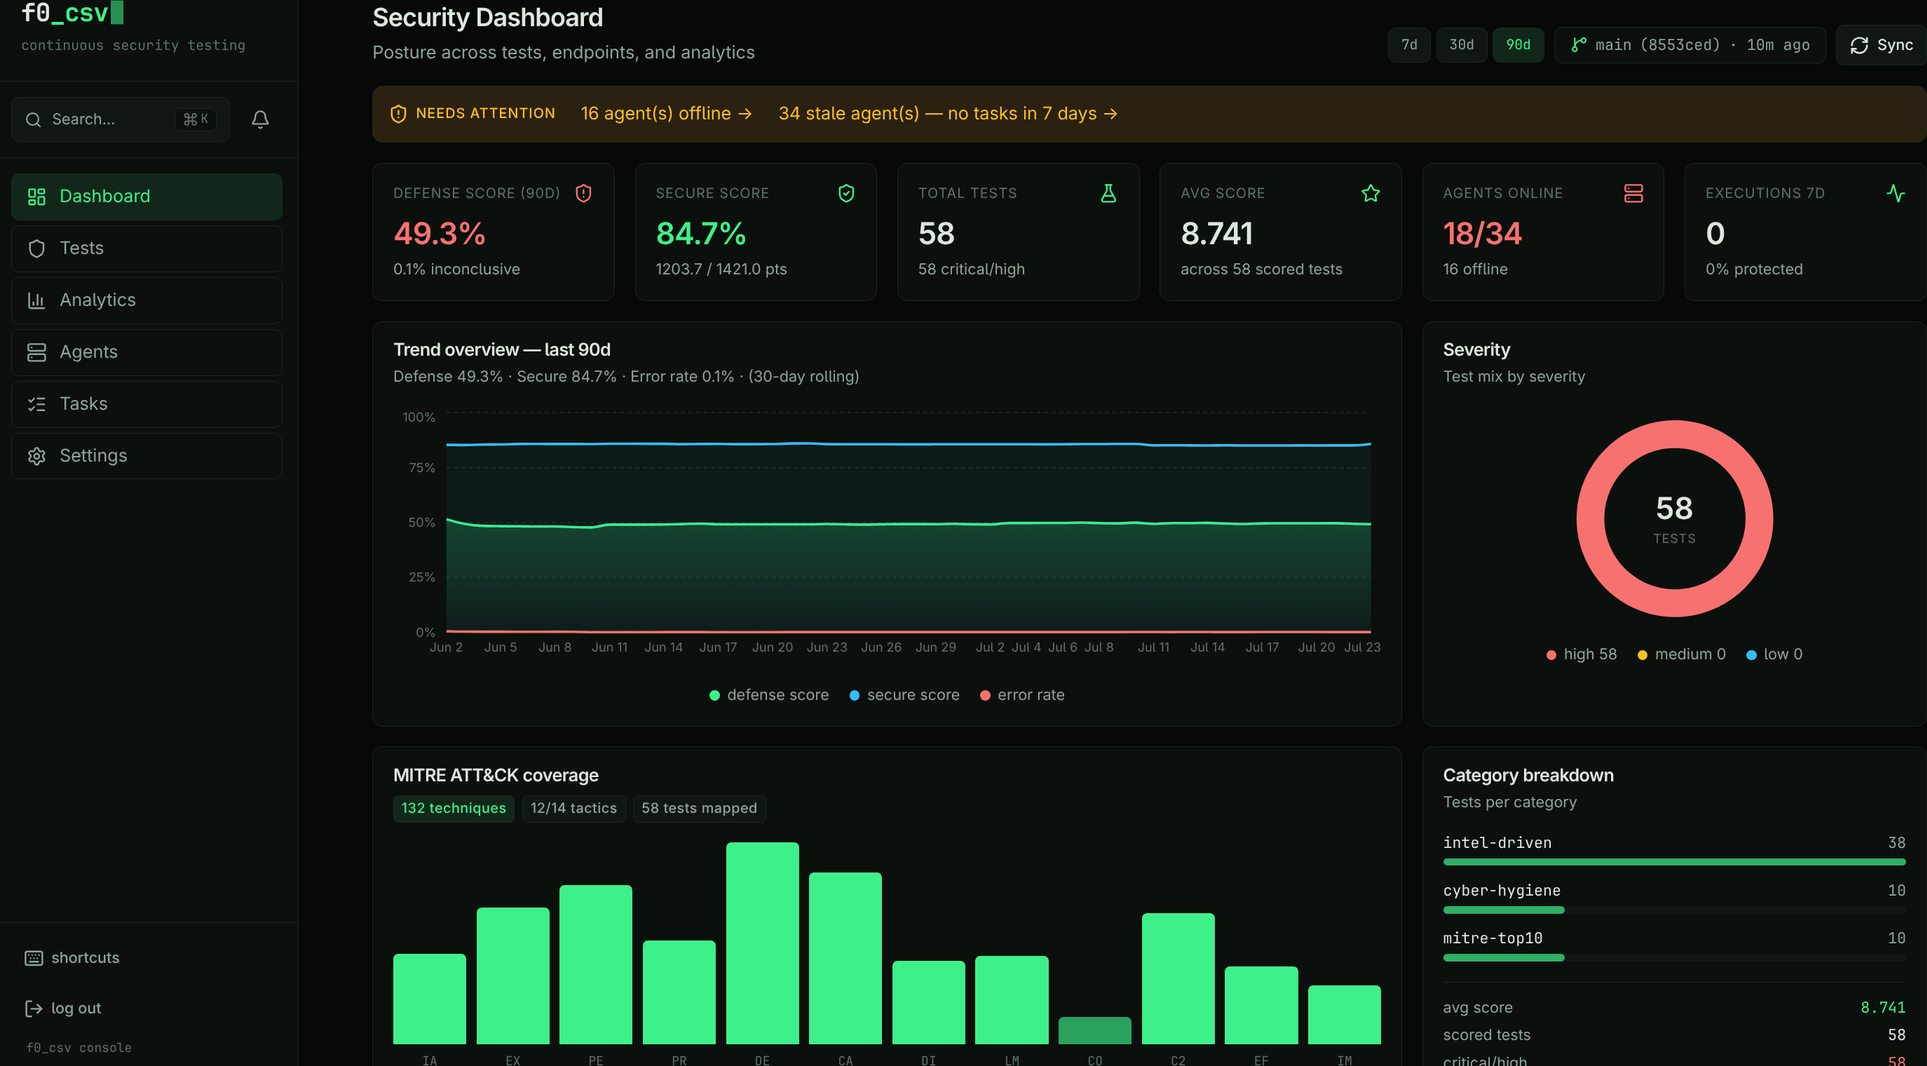
Time range
The header carries a 7d / 30d / 90d selector plus a git sync chip and a manual refresh. The range drives every windowed card on the page — Defense Score, trend overview, and execution counts — and defaults to 90d, matching the Analytics section's default window.
90 days is the default because most fleets run scheduled bundles weekly or monthly. A 7-day window on a monthly schedule shows an empty chart even though the programme is healthy.
Attention banner
When something needs a human, a warning strip appears above the KPI row with one link per issue. It is derived, not stored — each item links to the page that resolves it:
| Item | Trigger | Links to |
|---|---|---|
| Agents offline | One or more enrolled agents missed their heartbeat window | /agents |
| Stale agents | Agents with no task in 7 days | /agents |
| Failed tasks | Task failures in the last 24 hours | /tasks |
| Outdated agents | Agents running an older binary than the newest registered version | /agents |
| Sync failures | The test library git sync last failed | /tests |
No banner means nothing crossed a threshold.
KPI strip
Six cards, each reading from a different source so a single outage degrades one card rather than the page:
| KPI | Meaning |
|---|---|
| Defense Score | Protected share of results in the window; renders in danger colour below 60% |
| Secure Score | Microsoft Defender Secure Score, when the integration is configured |
| Total tests | Tests in the library, with a critical/high count |
| Avg score | Mean test score across scored tests |
| Agents online | Online / enrolled, with an offline count |
| Executions | Executions in the window and the protected percentage |
Cards
Trend overview — Defense Score, Secure Score, and error rate on one 30-day-rolling axis over the selected window.
Severity — a donut of the library's test mix by severity.
MITRE ATT&CK coverage — technique counts per tactic in kill-chain order, with totals for techniques, tactics, and mapped tests. Density is rendered with accent green at varying opacity.
Category breakdown — tests per category (intel-driven, cyber-hygiene, mitre-top10, …) as a bar list, with average score and critical/high counts.
Fleet health and recent executions round out the page; a recent
execution links straight to /analytics?expanded=<id>, opening that run in the
executions master-detail view.
Degradation, not redirects
Every card fetches independently. If Elasticsearch is unconfigured, the analytics cards show a "Configure →" link to Settings while the library and fleet cards keep working. The dashboard never redirects you away — that was the main complaint about the old per-module dashboards.
Related
- Console & Navigation — the shell, shortcuts, and theme
- Defense Score — how the score is computed
- Task Execution — the task stream behind the failed-task banner