Heartbeat & Monitoring
How Heartbeats Work
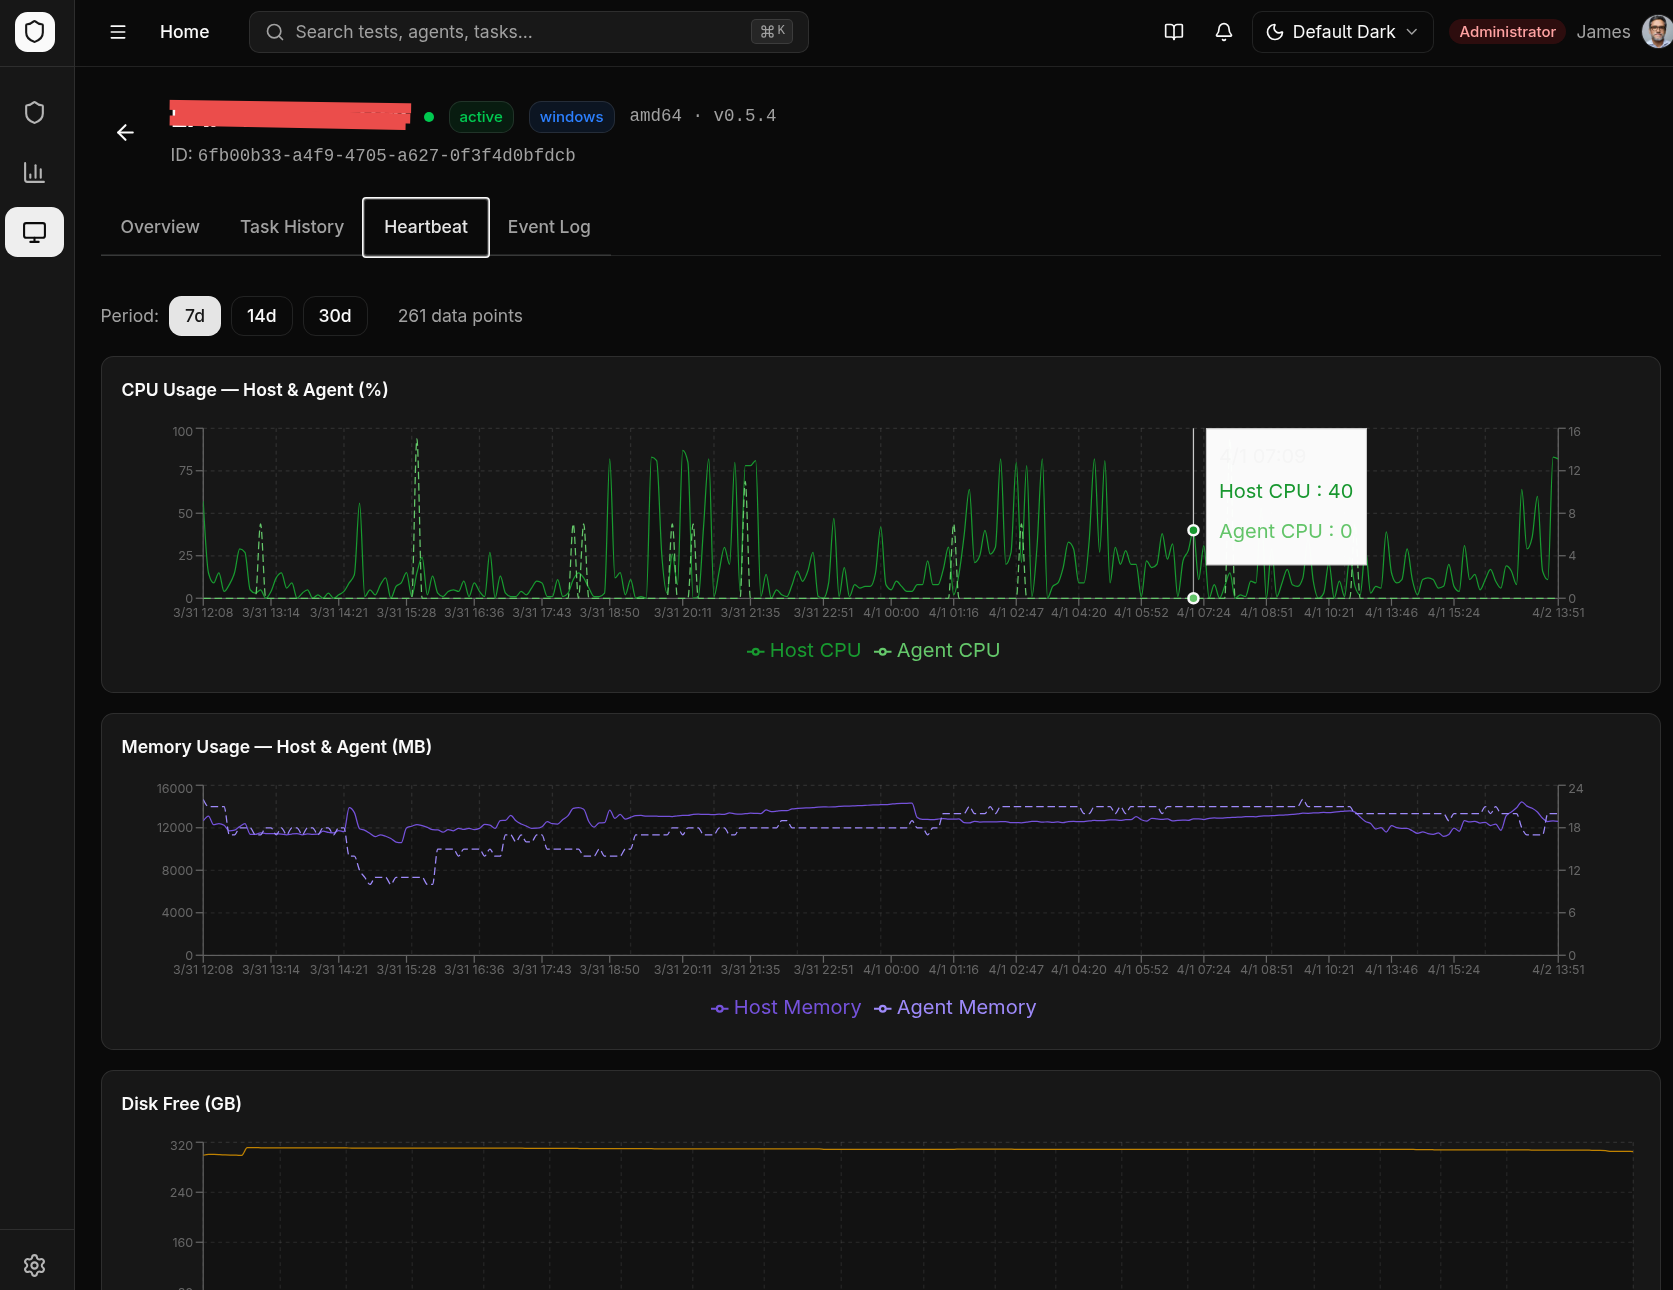
Each enrolled agent sends a heartbeat to the backend every 60 seconds (±5s jitter to prevent thundering herd). The heartbeat includes:
- System metrics — CPU usage, memory usage, disk usage, uptime
- Agent version — Current binary version
- Hostname and OS information
Agent Status
| Status | Meaning |
|---|---|
| Online | Heartbeat received within the last 2 minutes |
| Offline | No heartbeat for more than 2 minutes |
Agent Management UI
The Agents page displays:
- Agent hostname and IP
- Operating system and architecture
- Current status (online/offline)
- Last heartbeat timestamp
- CPU, memory, and disk usage meters
- Agent version
- Custom tags
Stale Task Detection
If an agent goes offline while executing a task, the task is automatically marked as failed with a stale detection message. This prevents tasks from hanging indefinitely.
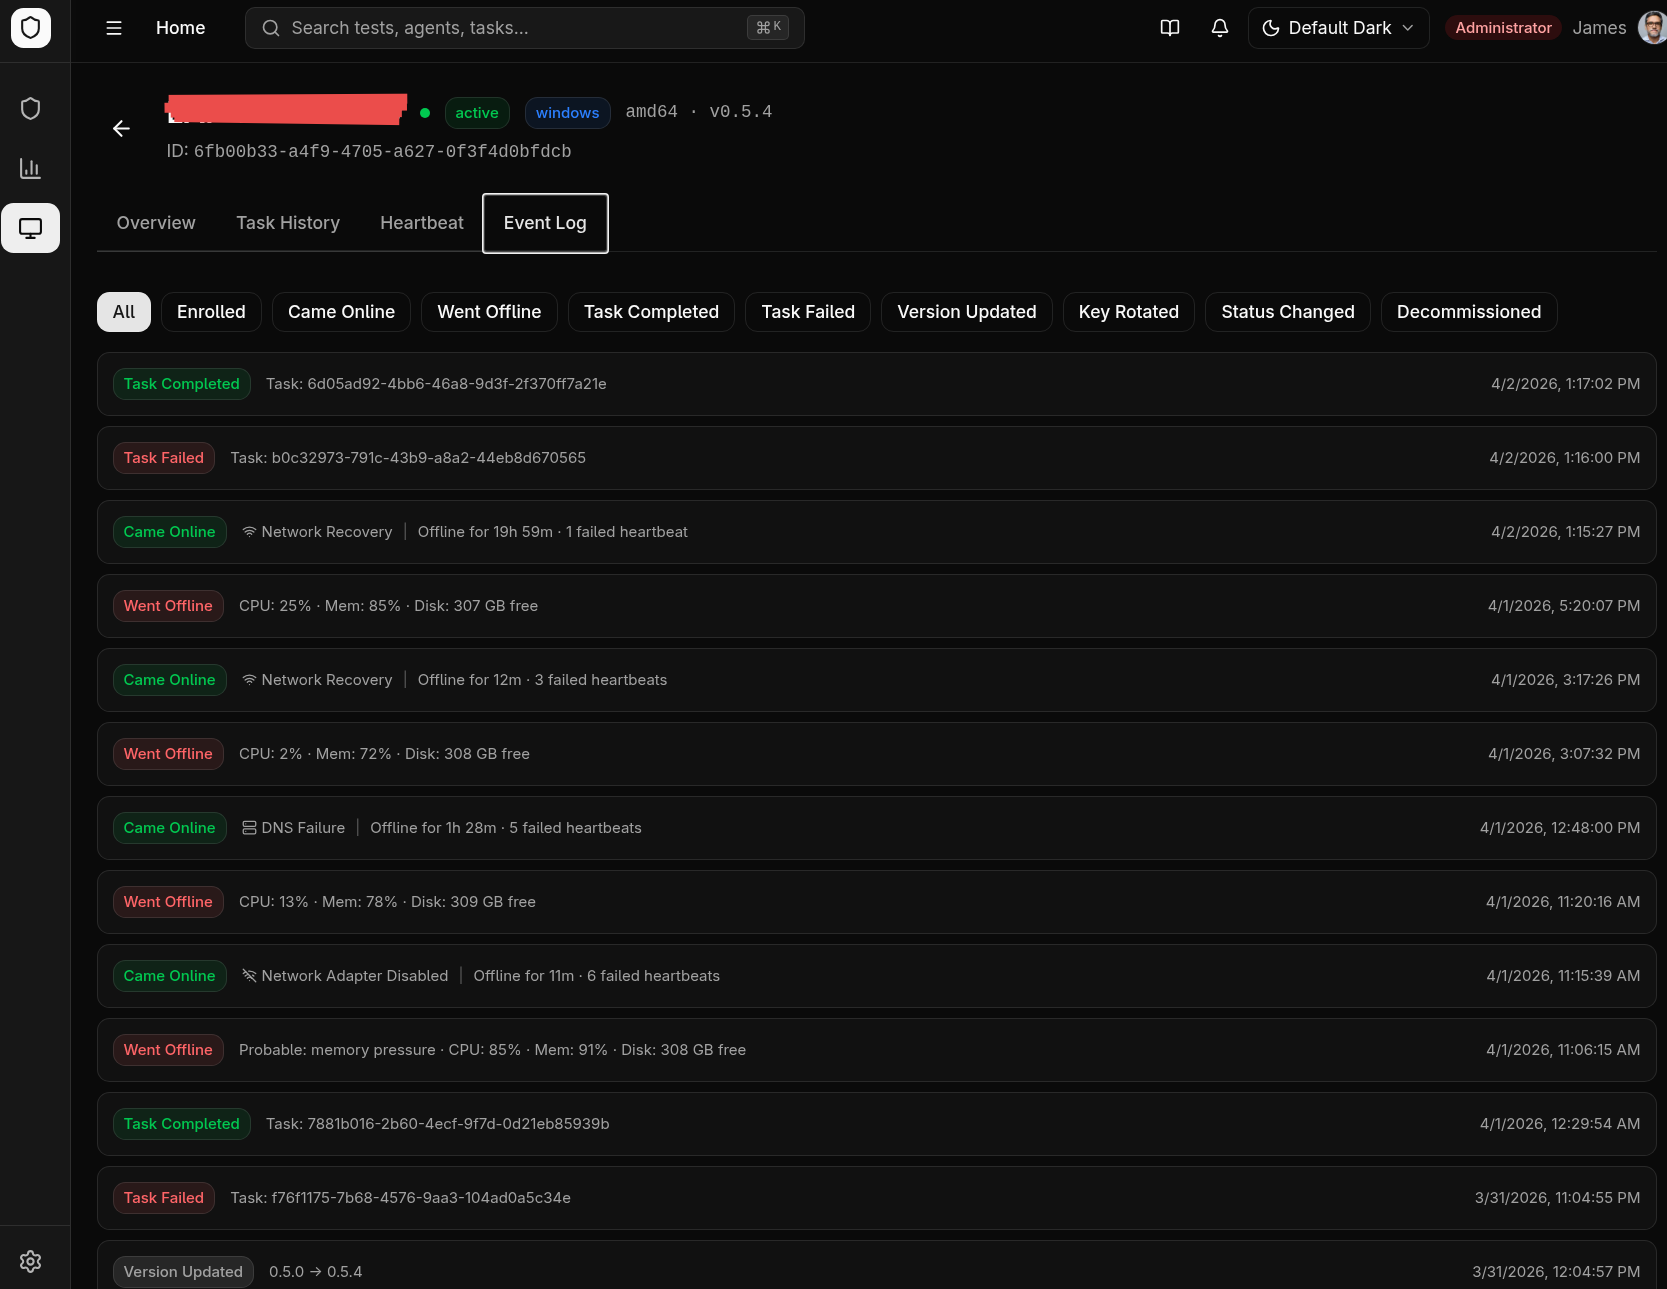
Disconnect Reason Reporting
When an agent reconnects after being offline, it reports why it was disconnected. The reason appears in the Event Log tab on the agent detail page, next to the "Came Online" event.
| Reason | Icon | Meaning |
|---|---|---|
| Service Restart | ↻ | Agent process crashed and the OS service manager restarted it |
| Machine Reboot | ⏻ | The host machine was rebooted |
| Network Adapter Disabled | 📵 | Network interface was disabled or disconnected |
| Server Unreachable | 🖥 | Agent could reach the network but the server refused connection |
| DNS Failure | 🔍 | DNS resolution failed — server hostname could not be resolved |
| Network Unreachable | 📵 | No network route to the server |
| Connection Timeout | ⏱ | Server did not respond within the timeout period |
| TLS/Certificate Error | 🔒 | TLS handshake failed (expired certificate, untrusted CA) |
| Disk Pressure (Crash) | 💾 | Agent crashed with critically low disk space (< 100 MB free) |
| Memory Pressure (Crash) | 🧠 | Agent crashed with critically high memory usage (> 90% of total) |
| Network Recovery | 📶 | Generic network issue resolved (none of the above specific causes matched) |
| Update Restart | ⬇ | Agent was restarted after applying a self-update |
| Unknown | ? | Reason could not be determined (typically agents running an older version) |
Reasons are detected via a dual-layer system: agent-side error classification (HTTP error type, network adapter state checks per platform) and backend-side last-known metrics correlation. Process restarts with high memory or low disk at the time of the last heartbeat are correlated with the last-known metrics to infer crash causes (e.g., a service_restart following a heartbeat with > 90% memory usage is tagged as memory_pressure_crash).
Adaptive Heartbeat Backoff
During extended server outages, the agent automatically reduces its heartbeat and polling frequency to minimize wasted network requests:
| Consecutive Failures | Heartbeat Interval | Task Poll Interval |
|---|---|---|
| 0–5 | Normal (60s) | Normal (30s) |
| 6–10 | 5 minutes | 5 minutes |
| 11–20 | 15 minutes | 15 minutes |
| 21+ | 30 minutes (cap) | 30 minutes (cap) |
On the first successful heartbeat after an outage, both intervals snap back to normal immediately. The agent logs the recovery: connectivity recovered after N consecutive failures, resetting intervals.
Agent Health Score
Each agent is assigned a health score (0–100) visible in the Agents list and on the agent detail page. The score is computed from three metrics over the past 7 days:
| Component | Weight | Description |
|---|---|---|
| Heartbeat Consistency | 40% | Ratio of received heartbeats to expected heartbeats |
| Task Success Rate | 30% | Completed tasks ÷ (completed + failed tasks) |
| Stability | 30% | Fewer disconnections = higher score (10+ disconnects in 7 days = 0% stability) |
The score is color-coded in the UI:
- Green (80–100) — Healthy agent
- Amber (50–79) — Some reliability issues
- Red (0–49) — Unreliable, investigate
The fleet average health score is also shown on the Endpoints Dashboard.