Test Detail Pages
Clicking any test in the browser opens its detail page with comprehensive metadata.
Page Layout
A header strip carries severity, stage count, author, platform, threat actor, and test score; the MITRE technique chips sit beneath it. Below that, a file tree on the left drives a viewer on the right.
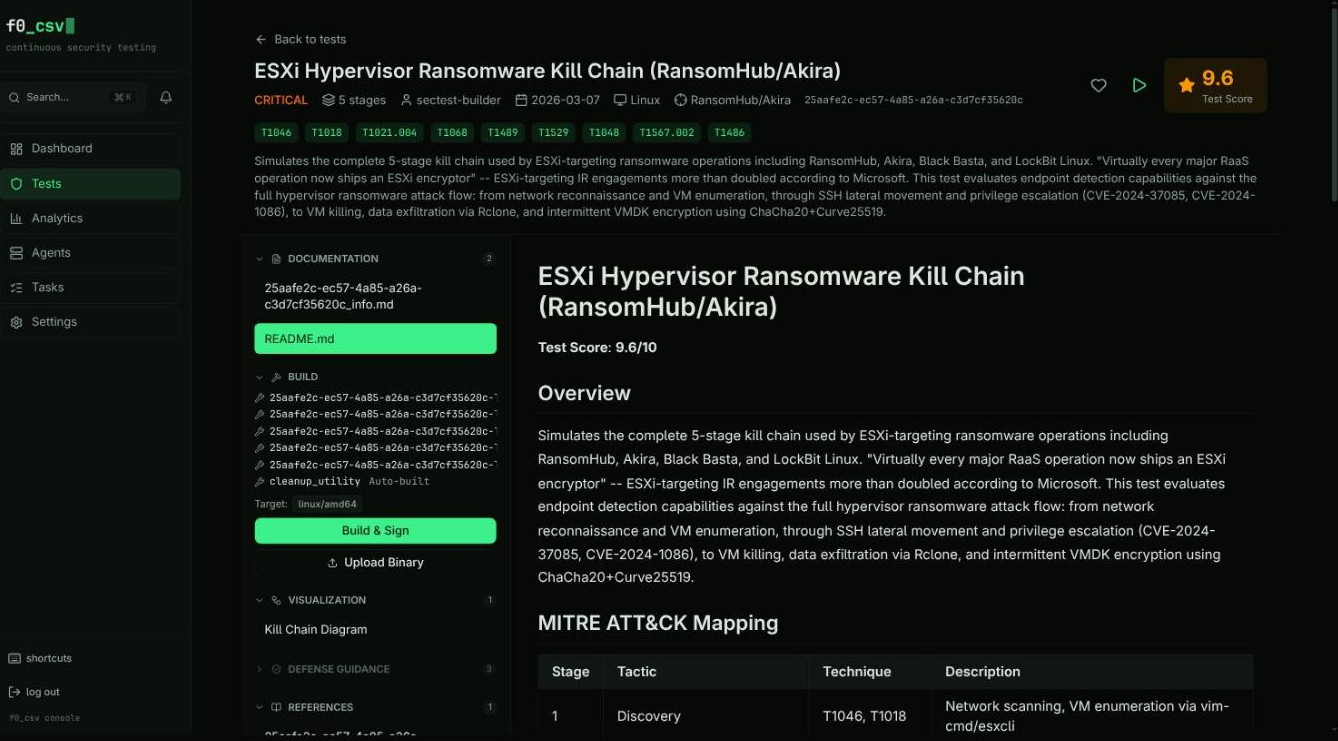
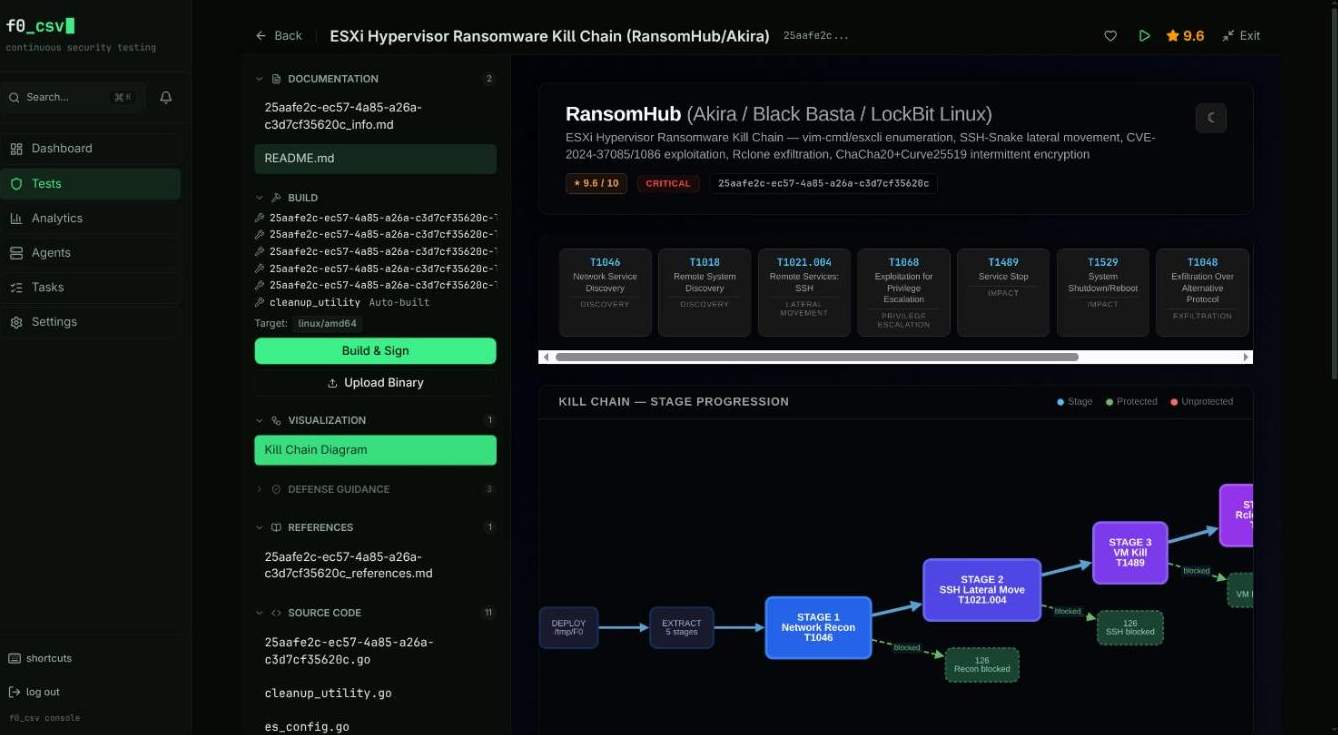
The tree groups a test's artifacts into Documentation, Build, Visualization, Defense Guidance, References, and Source Code. Selecting an entry renders it in place:
Source Tab
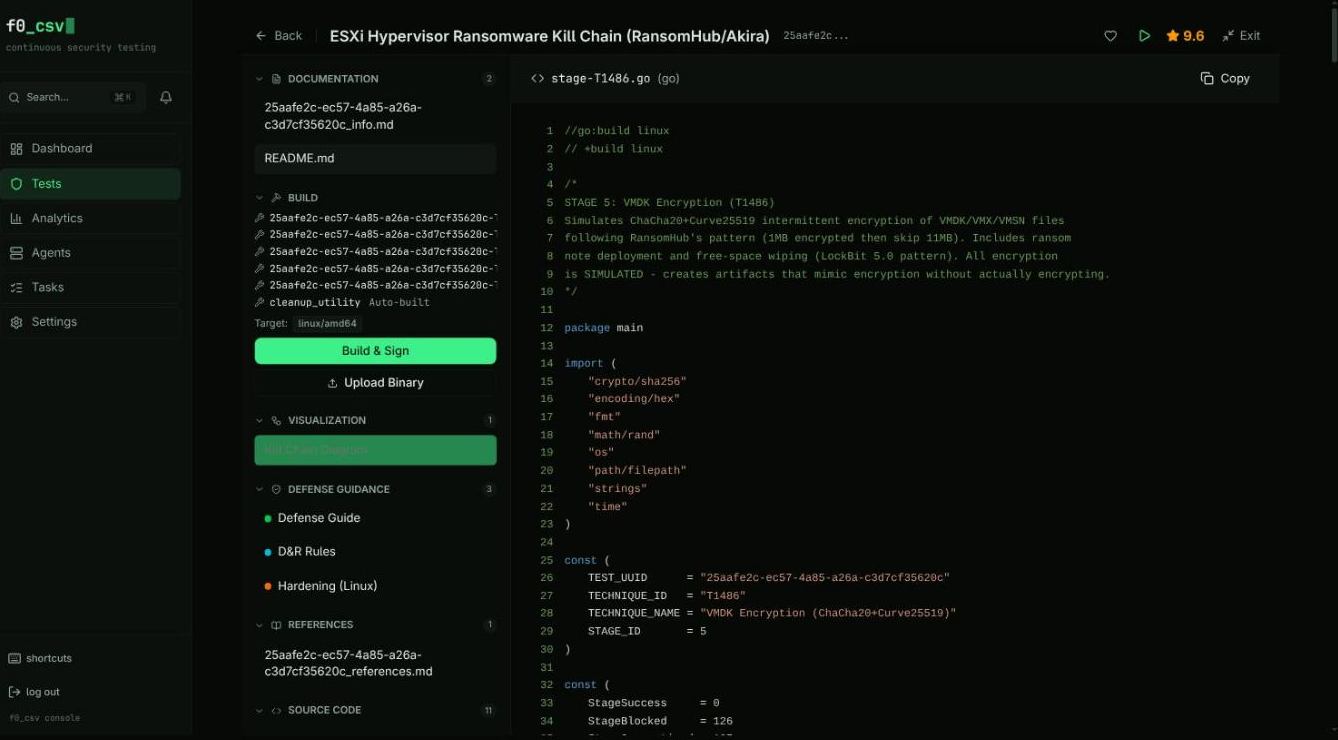
View the test's Go source code with syntax highlighting. Copy-to-clipboard available for the entire file.
Documentation Tab
Rendered markdown documentation describing the test's purpose, behavior, and expected outcomes.
Detection Rules Tab
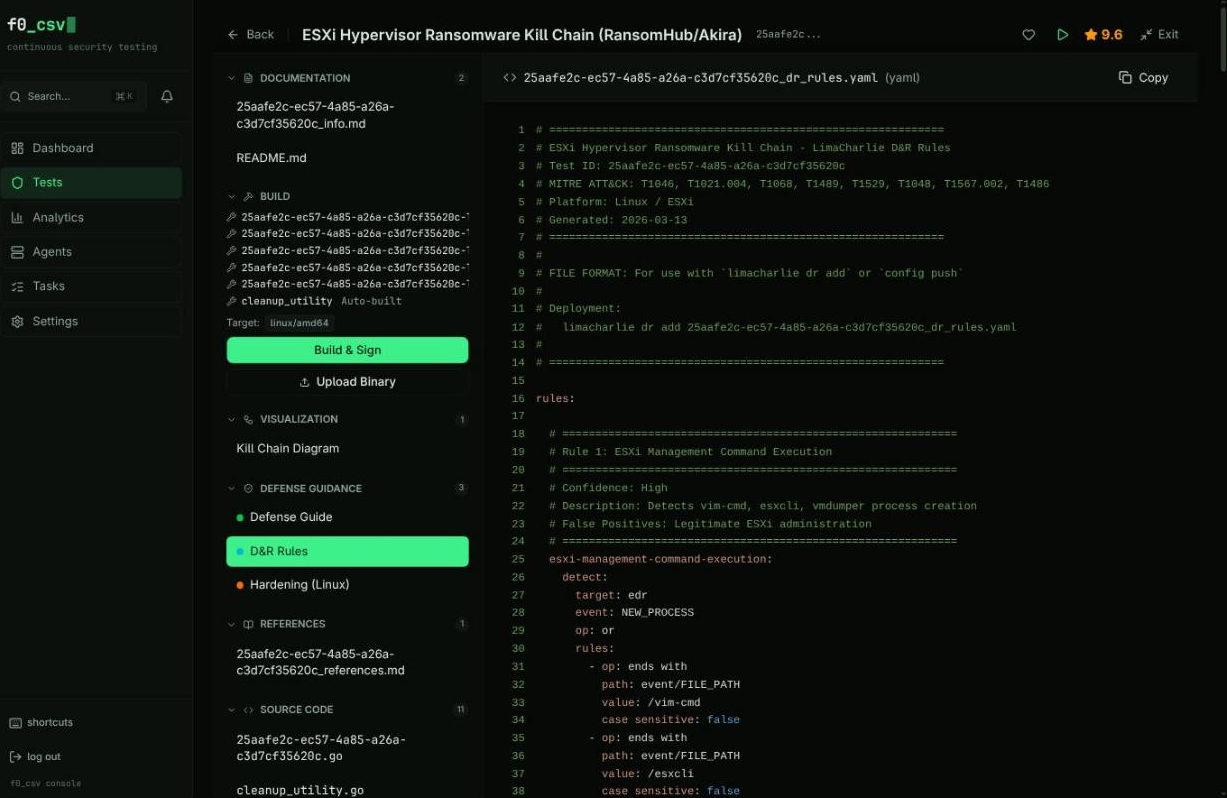
KQL (Kusto Query Language) and YARA rules for detecting the test's activity. Copy individual rules to clipboard for use in your SIEM.
References Tab
External references and documentation links related to the technique.
Metadata Sidebar
The sidebar displays:
- MITRE ATT&CK mapping — Techniques and tactics
- Severity — Critical, High, Medium, or Low
- Platforms — Windows, Linux, macOS
- Author and version history
- Git modification date
- Tags for additional categorization
Execution Drawer
Click the Run button to open the execution drawer, which allows you to:
- Select target agent(s)
- Choose the target platform and architecture
- Build the test binary (if not cached)
- Create a task for execution
Build & Download
The Build button triggers Go cross-compilation for the selected platform. See Building & Signing for details.